
RSI tracks the change and speed of price movement on a scale of 0 to 100.
It is ploted by calculating the average of the gains and losses.
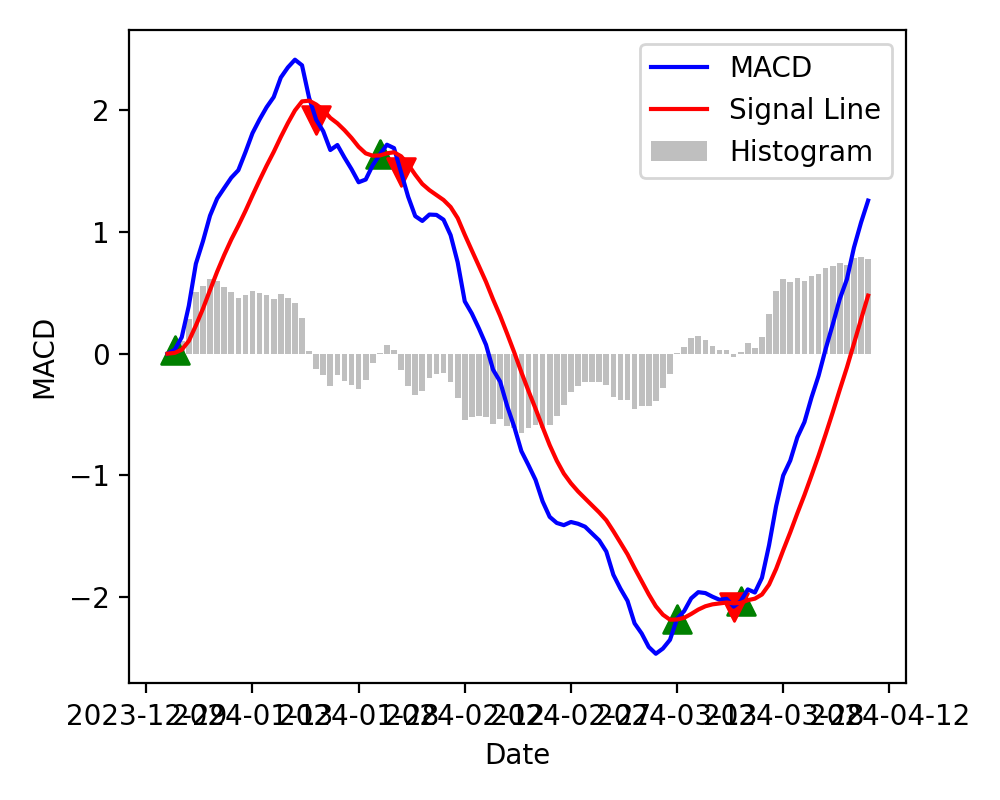
MACD is created to show the relationship between two Exponential Moving Average i.e typically 12-day and 26-day.
It includes a MACD line, a signal line (9-day EMA of the MACD line), and a histogram showing the difference between the MACD line and the signal line.
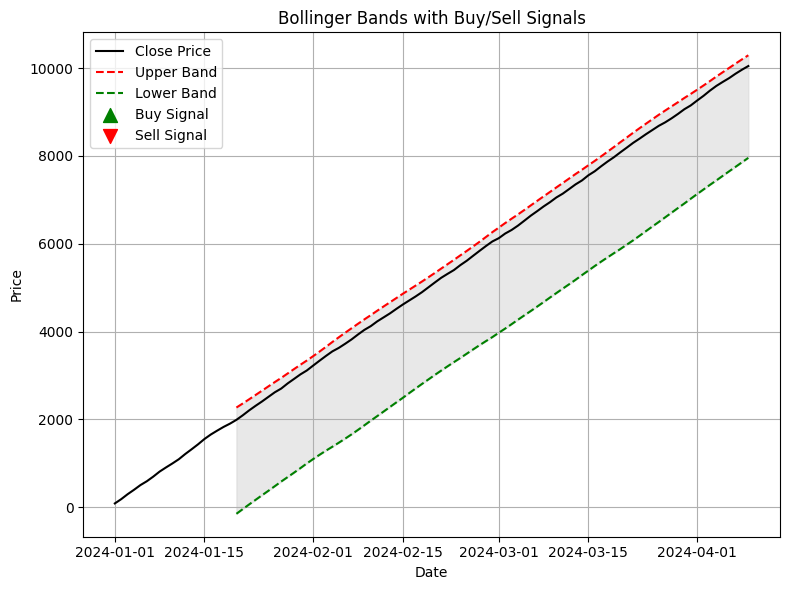
Bollinger Bands consist of three bands with a middle band as Small Moving Average (SMA) and two outer bands as standard deviations away from the SMA. The bands expand and contract based on market volatility.
The default period for the SMA is 20 days, with the bands set two standard deviations away from the SMA.
Bollinger Band squeeze indicates reduced volatility and potential for future price movement.

The stochastic oscillator compares the closing price to the price range over a specified period. It produces values between 0 and 100.
The default settings are 14 periods for the %K line and 3-period smoothing for the %D line.
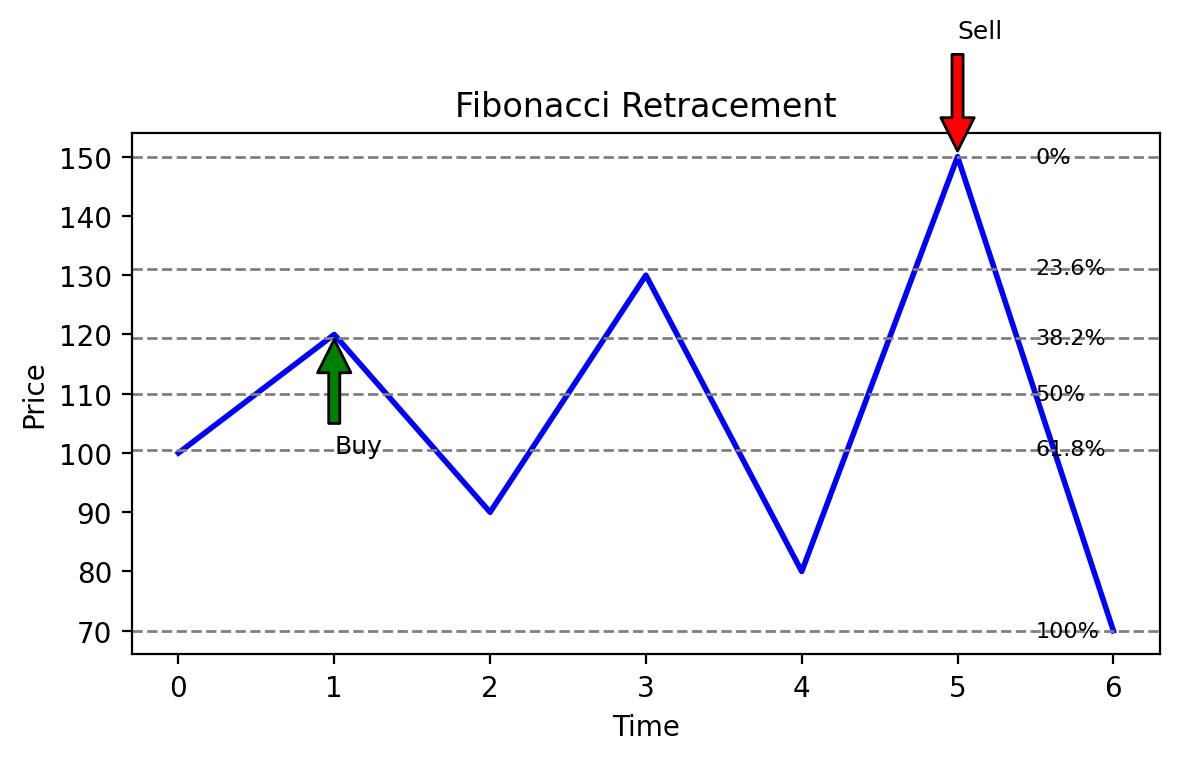
Fibonacci retracement levels are horizontal lines that indicate potential support and resistance levels based on Fibonacci ratios.
Identify the most recent significant high and low on the chart.
Draw retracement levels between these points using Fibonacci ratios (23.6%, 38.2%, 50%, 61.8%, 76.4%).
Price often retraces to these Fibonacci levels before continuing in the direction of the original trend. These levels can help identify potential reversal points.
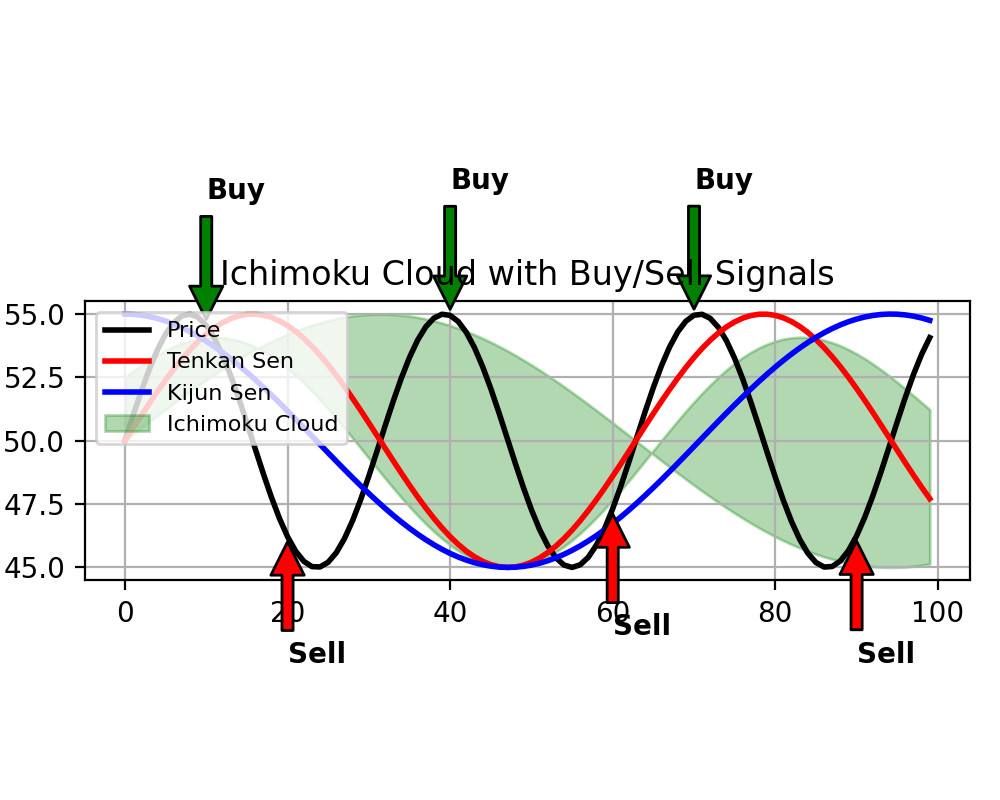
The Ichimoku Cloud includes five lines: Tenkan-sen (9-period), Kijun-sen (26-period), Senkou Span A (leading span A), Senkou Span B (leading span B), and Chikou Span (lagging span). It creates a "cloud" on the chart to provide support and resistance levels and trend direction.
The default settings of ichimoku Cloud is 9, 26, and 52 periods for the respective lines.